UX Designer


From Pilot Project to Policy Impact
UX Research | Co-Author, Federal Evaluation Report
The Challenge
During the COVID-19 pandemic, transit agencies faced a dual challenge: maintaining safety protocols like physical distancing while continuing to serve riders with mobility devices who often required driver assistance. The QUANTUM automatic wheelchair securement system was introduced as a potential solution—but adoption and impact across agencies remained unclear.
Project Details
Timeline: 18 months (2022-2025). I contributed during the 2025 phase of the evaluation
Role: UX Researcher + Co-Author, Federal Evaluation Report. Co-led research across 3 transit agencies and co-authored the forthcoming final evaluation report to the Federal Transportation Administration (FTA)
Team: Rotating UX team (5 researchers total), 1 PM, and MDOT OPT Stakeholders
Client: Michigan Department of Transportation (MDOT) — Office of Passenger Transportation (OPT)
Deliverables: Final evaluation report (co-authored), stakeholder presentations, cross-agency analysis, field notes + interview documentation
Project Context:vPart of an FTA-funded COVID-19 Research Demonstration Grant administered by MDOT OPT to pilot automatic wheelchair securement technology on public transit vehicles and evaluate its impact on safety, accessibility, and operator workflow

Map of Michigan with the three participating transit agencies marked: Jackson Area Transportation Authority (JATA), Saginaw Transit Authority Regional Services (STARS), and Blue Water Area Transit (BWAT)
Objective
Evaluate the effectiveness of automated wheelchair securement in enhancing rider independence, safety, and dignity—while uncovering system-level enablers and barriers to adoption across agencies.
The Challenge
Give space researchers an elegant and intuitive way to manage and reduce the dimensionality of their data so they can better analyze and interpret phenomena in space.
My Role
As part of a rotating team of five UX researchers, I joined the final phase of a multi-year qualitative evaluation.
-
Conducted in-field user research across three Michigan transit agencies.
-
Observed riders and drivers using the system in real-world contexts.
-
Led interviews with riders, drivers, and transit staff.
-
Synthesized findings across all three sites and across the three rounds of observations into actionable insights for state and federal reporting.
-
Co-authored the forthcoming final report to be submitted to the FTA.

QUANTUM Automatic Wheelchair Securement Station on a JATA bus, November 2023
Strategy
The prior phases of data collection did not yield the planned number of observations, so our team redesigned the study to capture more reliable, in-context insights. Key to this strategy was a focus on three research themes: adoption drivers, rider autonomy and dignity, and operational barriers.
-
Coordination with stakeholders: We worked directly with transit agency staff to schedule observations and ensure that we captured accurate, day-to-day experiences of system use. This collaboration allowed us to align our research efforts with broader policy goals from the FTA and MDOT while focusing on the local context of each transit agency.
-
Data collection: We focused on a mixed-method approach that combined in-field observations of riders securing their devices with semi-structured interviews. This ensured we captured both immediate user behaviors and longer-term patterns in system adoption.
-
Cross-agency comparison: By evaluating three distinct agencies, we were able to identify unique local factors—such as staff training, vehicle configurations, and rider familiarity—that influenced how well the system was integrated into each transit agency’s operations.

Approach
We conducted site visits at three transit agencies equipped with the QUANTUM system as part of the grant.

Jackson Area Transportation Authority (JATA)

Blue Water Area Transit (BWAT)

Saginaw Transit Authority Regional Services (STARS)
Research Methods
-
Contextual observations: 18 riders were observed securing their mobility devices using the QUANTUM system to identify behavioral and interactional challenges.
-
Semi-structured interviews: We conducted interviews with all riders, as well as with 21 transit agency staff (drivers, supervisors, and maintenance staff) and 5 community members who interacted with the system to uncover insights into user adoption, system fit, and operational challenges.
-
Contextual inquiry: On-site discussions were held with transit agency staff to understand how policies, infrastructure, and training impacted system use.
-
Collaborative synthesis: We facilitated sessions across all agencies to identify recurring themes and draw actionable insights from the diverse user experiences.
With the [arm] holding the wheel, it stops you from tipping…it’s a great system, whoever designed it.”
Rider
Key Findings
-
Driver support was essential: Drivers who actively supported or coached riders made the biggest difference in adoption.
-
Rider behavior and trust shaped adoption: Riders rarely adopted the system independently initially unless prompted by drivers. Confusion about how the system worked and discomfort with the rear-facing orientation of the station were common barriers.
-
System design didn’t fit all mobility devices: The system had compatibility issues with a minority of mobility devices. Riders avoided using the seatbelt, citing discomfort and difficulty accessing it.
-
Vehicle layout and rider-device fit presented operational challenges:
While Q'Straint provided strong training and support, some agencies still faced challenges related to physical space constraints and retrofitting older vehicles. These layout limitations sometimes affected how easily riders could maneuver into position or how consistently the system could be used across different bus types.
-
System use had become normalized at many sites: By the time we returned for the final evaluation phase in 2025, the QUANTUM system had become a routine part of operations at several agencies. Riders and drivers were comfortable with the securement process, and fewer usability issues were observed compared to earlier rounds. This shift suggests that consistent exposure, driver reinforcement, and operational integration played key roles in normalizing the technology over time.
Outcomes
The findings were compiled into the final evaluation report submitted to MDOT and the FTA. Our research illuminated key factors that influence the real-world success of automated wheelchair securement systems. These insights will inform future decisions regarding accessibile transit technologies and improvements to rider and driver experiences.
Once you learn how to get [the wheelchair] in right, it’s good.”
Rider

Insights
-
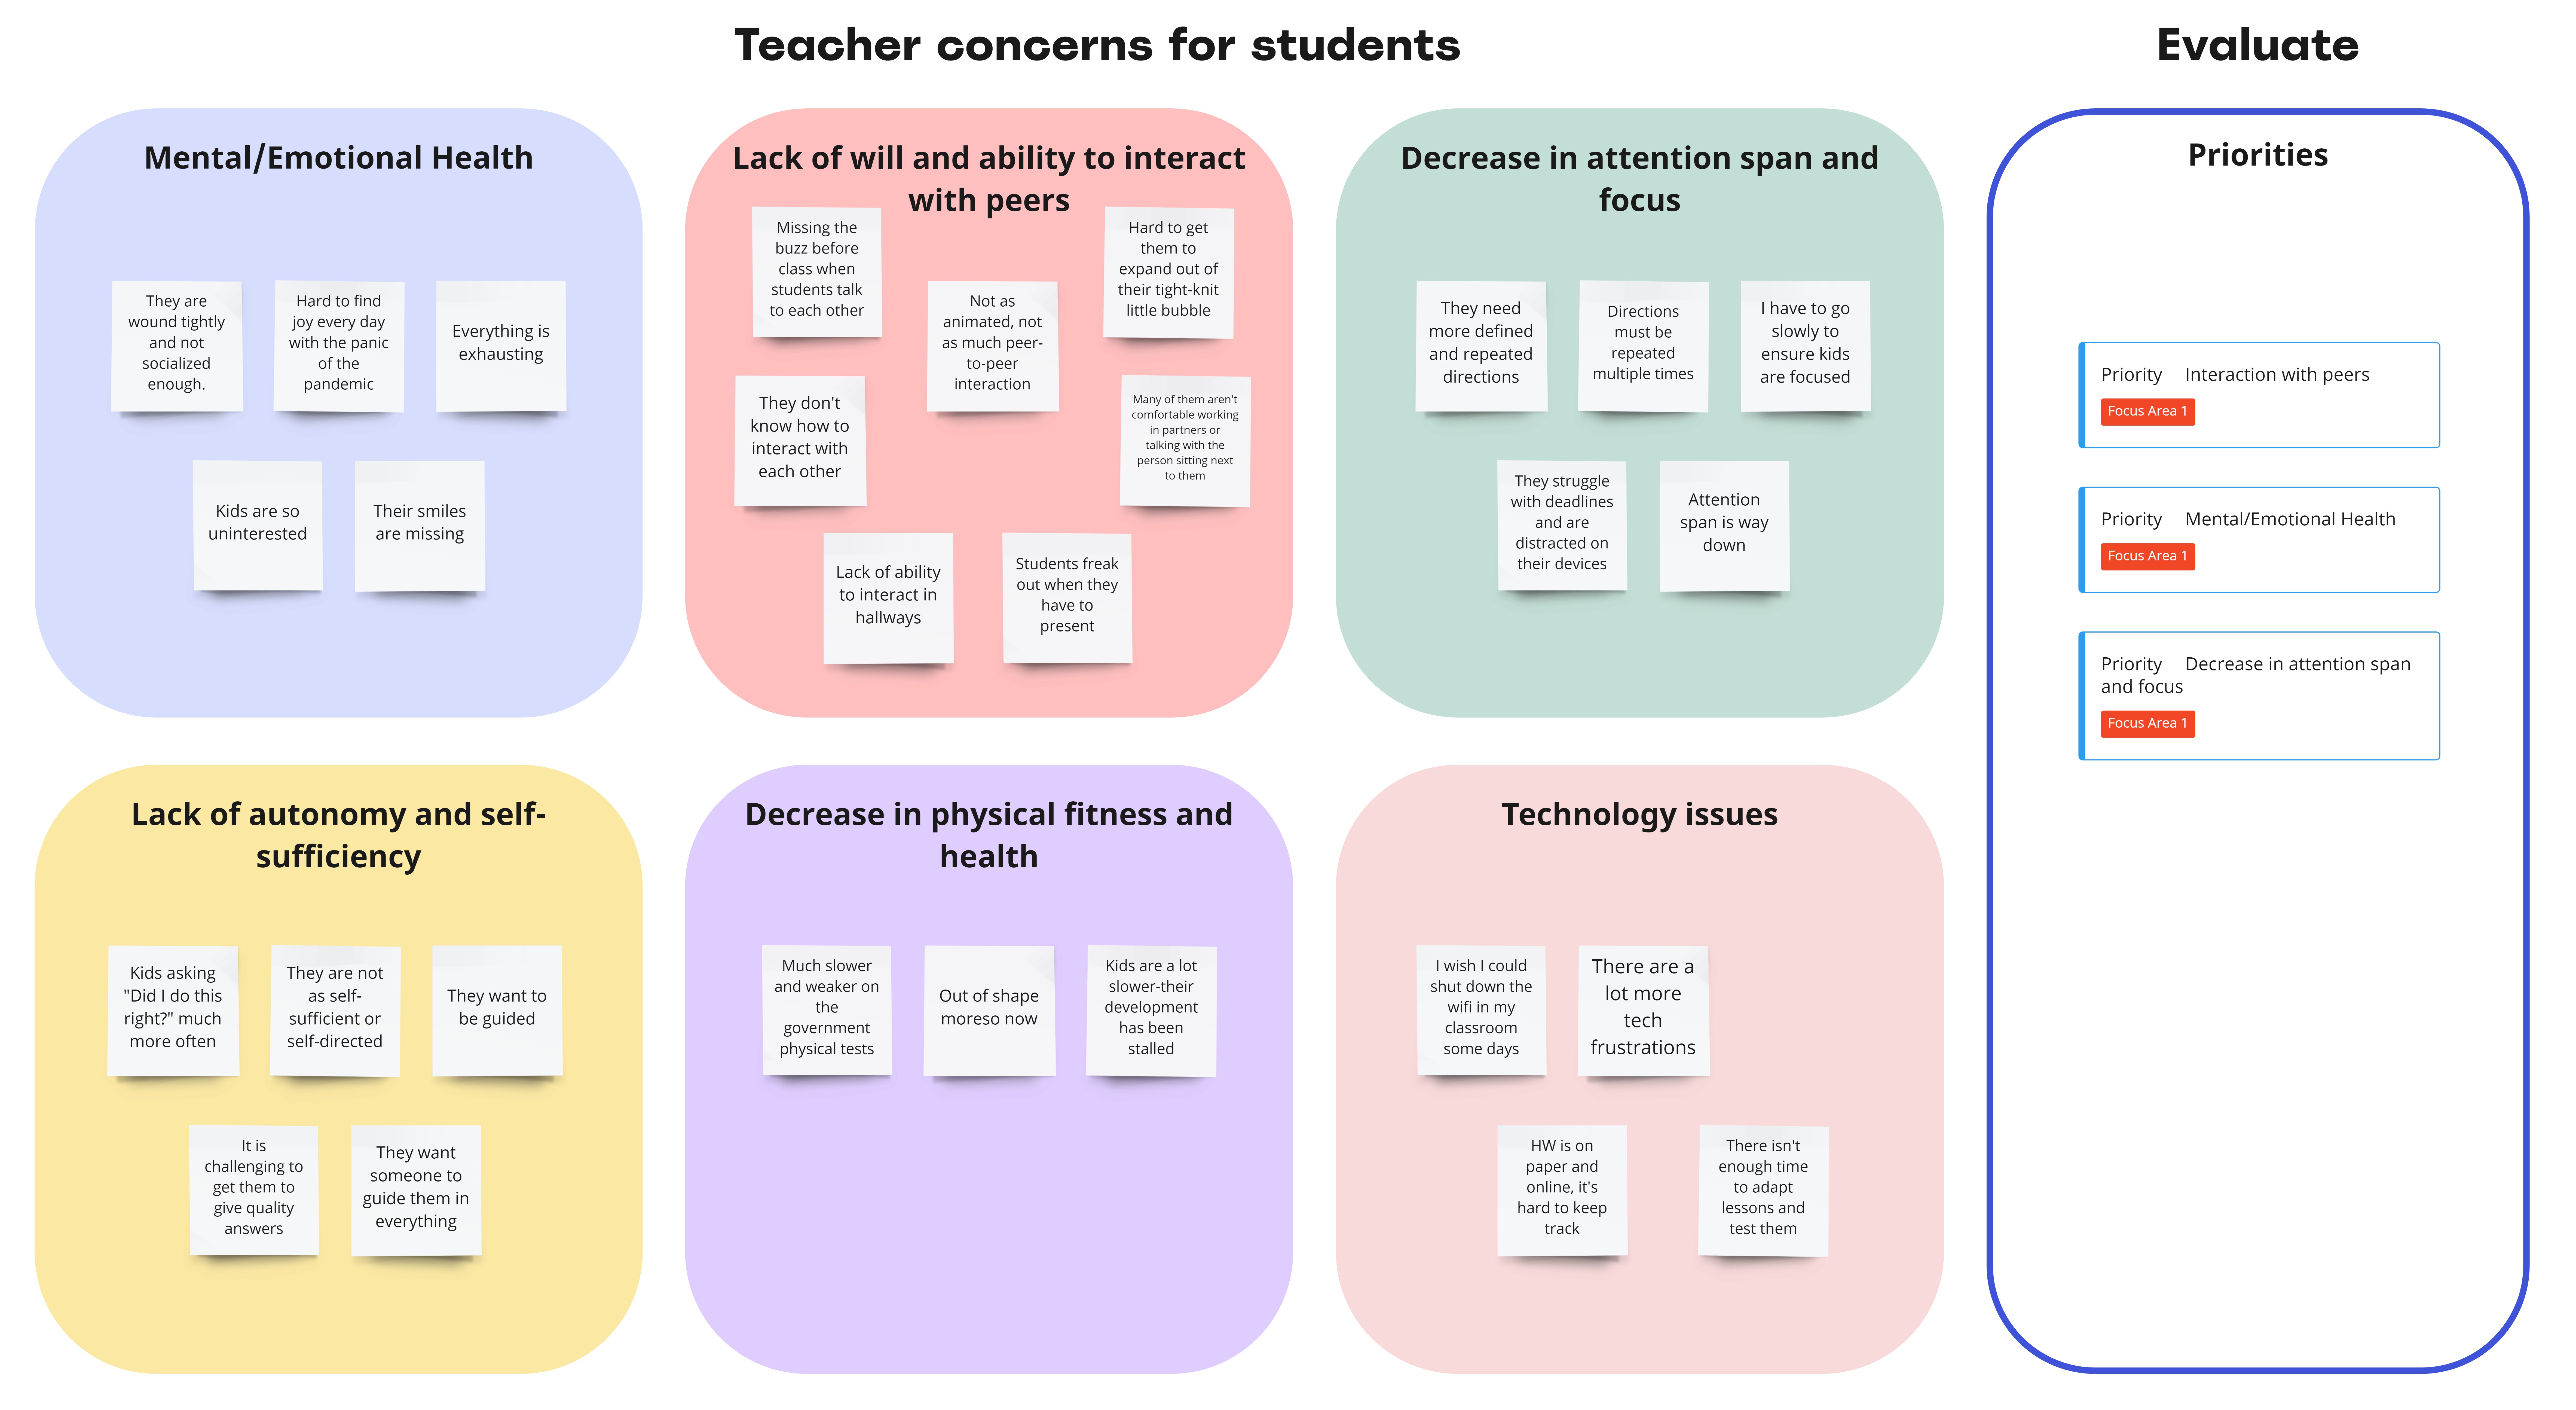
The affinity map based on our interviews led to six key themes and four priority insights we wanted to address.
-
How Might We questions narrowed the focus of our solution.
Affinity Map

One
Essential Dimensions:
Scientists needed to visualize data across critical dimensions including time, energy, flux, look direction of the space instrument, and pitch angle. Additional dimensions would emerge once the spacecraft launched.
Two
Analytical Control:
They needed the flexibility to reduce the dataset by averaging over specific variables or slicing individual dimensions to explore patterns.
Three
Visual Flexibility:
Traditional 2D plots were not enough. Users needed to manipulate the data space more fluidly--beyond x/y plots.
Key Insights
Goal Statement
Our EdTech learning platform will let students practice academic content while encouraging interpersonal communication which will improve academic performance and interpersonal skills and engage students in the school environment.
Filling the gap
There were so many stellar academic products on the market already, so we realized that the best way to solve our problem was to create a layer of interpersonal activities that integrates with the online academic practice tools teachers already use to help students communicate and have fun with each other.

Iteration and Refinement
Client Feedback:
In collaboration working sessions, we discovered the original design needed more granularity and flexibility. Based on stakeholder input, we:
-
Introduced a table view for selecting individual Look Directions (80 total) and averaging subsets
-
Replaced a static slider with a grouped view (10s) to make navigating high-volume datasets scalable
-
Ensured the component design would remain usable as more data dimensions became available
Wireframes
I created this rough wireframe and a lo-fi prototype to explore our concept through the teacher user flow.
For our initial mockups, we chose a calming blue theme for our design. These mockups follow the lo-fi wireframes closely.
Initial mockups
_edited.jpg)

Final Homepage Mockup
To simplify the usability, I condensed all of the main actions to the header.

COMING UP: Usability Testing and Refinement
We finalized our designs three weeks after addressing this core dimensionality reduction feature. Next, we planned usability testing with additional scientists beyond the core stakeholder group.
Key Feature: Reducing Dimensionality
Dimensionality Visualization: Joanie effortlessly manages dimensions like time, energy, flux, look direction, pitch angle, and mass.
Adjusting Dimensions: Joanie can average dimensions, select individual slices of dimensions to analyze, or average subsets of data, in addition to choosing which dimensions to put on the x-, y-, and z-axes.
Intuitive Interface: Our design supports both novice and expert users, minimizing the need for coding.

Outcome
The feature we developed for reducing dimensionality will greatly benefit the IMAP mission. Scientists like Joanie will be able to conduct advanced data analysis more efficiently and accurately. Our iterative, user-driven approach ensures the tool will meet all requirements and be ready for the 2025 launch.
Results
-
Improved clarity: Scientists reported a more intuitive experience compared to their self-built tools
-
Expanded flexibility: Enabled workflows not previously possible in their own tools
-
Validated concept: Design finalized and queued for implementation ahead of live mission data
Lessons Learned
-
Technology alone isn’t enough: Even well-designed systems require cultural, behavioral, and policy support to succeed. The rider experience must be embedded in every layer of implementation.
-
Accessibility requires advocacy: Rider independence improved only when drivers encouraged and supported new behaviors. Building accessibility into operations takes more than hardware—it takes champions.
-
Adoption takes time—and consistency: Initial resistance to new technology is common, but sustained exposure and consistent driver support can lead to normalization. Agencies that treated the system as a standard part of operations, rather than a pilot or optional tool, saw smoother integration and greater rider comfort over time.
